3Q 2024 Review and Outlook
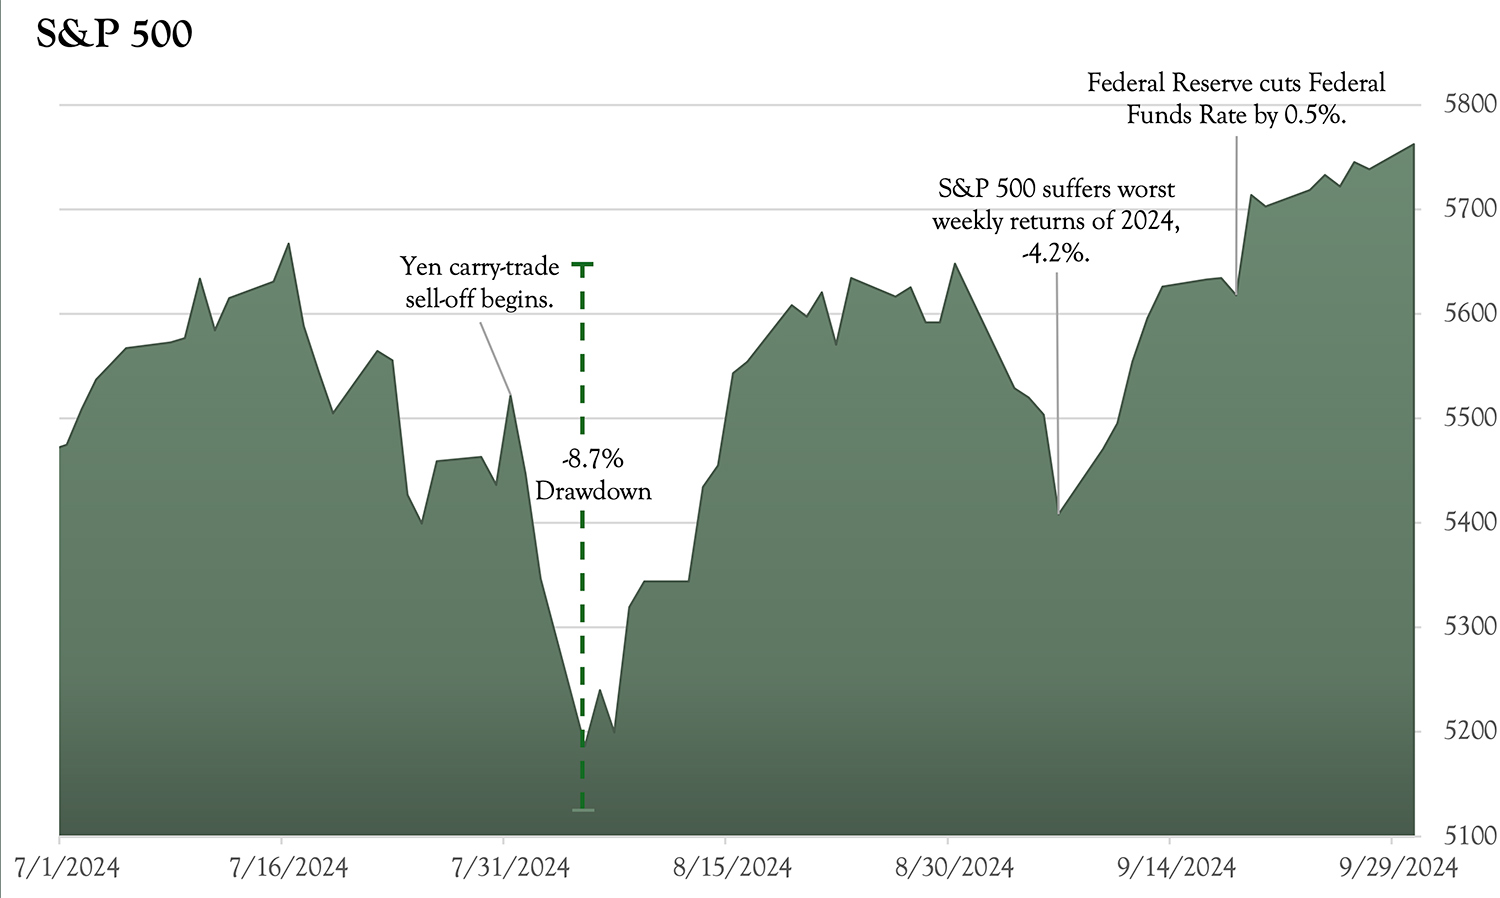
The third quarter of 2024 was marked by increased conflict in the Middle East, a higher-than-expected U.S. unemployment print, an abrupt change of one Presidential candidate, and two assassination attempts on the other. Yet, despite all of this, equity markets gained ground as the Federal Reserve lowered the Federal Funds rate by 0.5%, adding fuel on the economic fire powering the S&P 500 Index to a +5.9% return and a record high.
Last quarter, we wrote about the potential broadening out of returns that we surmised would benefit small-cap and international stocks. That proved accurate with the small-cap Russell 2000 posting a +9.3% return and broad international stock benchmarks notching gains of +7.4%, both besting the S&P. In the U.S Large-cap space, Financial, Industrial and Utility sectors posted the strongest gains, while Technology and Materials lagged. Energy stocks were generally down.
The bond market also posted solid returns for the quarter. Interest rates declined, pushing bond prices higher. Add in coupon interest and the bond market benchmark was up +3.5%. Municipal bonds also saw gains for the quarter.

What drove the stock market?
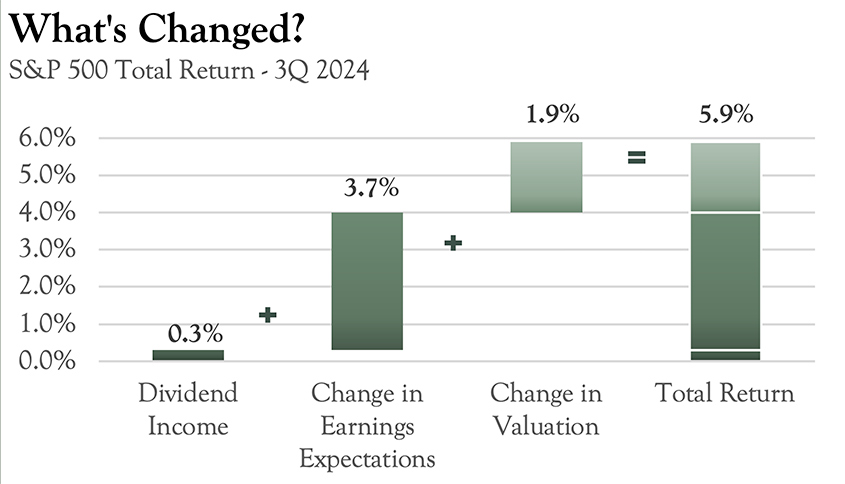
“What’s Changed?” is a simple explanation of what happened in S&P 500 during the most recent period but does not necessarily explain why the market moved. Let’s explore the “why” by looking at three individual components that shape market changes.

Dividend Yield: The most stable of the three factors. Dividend yields were approximately +0.3% this quarter (roughly 1.2% annualized).
Change in Earnings Expectations: Over the long term, earnings tend to drive stock prices. Earnings expectations this quarter surged +3.7%, an indication that profit-drivers in the economy remain very much on track, if not given a shot of jet fuel at the September 18th Federal Reserve meeting when the target Fed funds rate was cut by 0.5%.
Change in Valuation (Price/Earnings ratio): This number is generally more volatile than the earnings component – it is a measure of how investors value company earnings. Over the past 3 months, economists made a dramatic turn from expecting no interest rate cuts from the Fed to debating if the Fed would cut rates by 0.25% or 0.5% per meeting. The resulting 0.5% cut bolstered enthusiasm even further that a recession might be avoided. This hopeful sentiment helped drive the price-to-earnings ratio higher by +1.9%.
What drove the bond market?
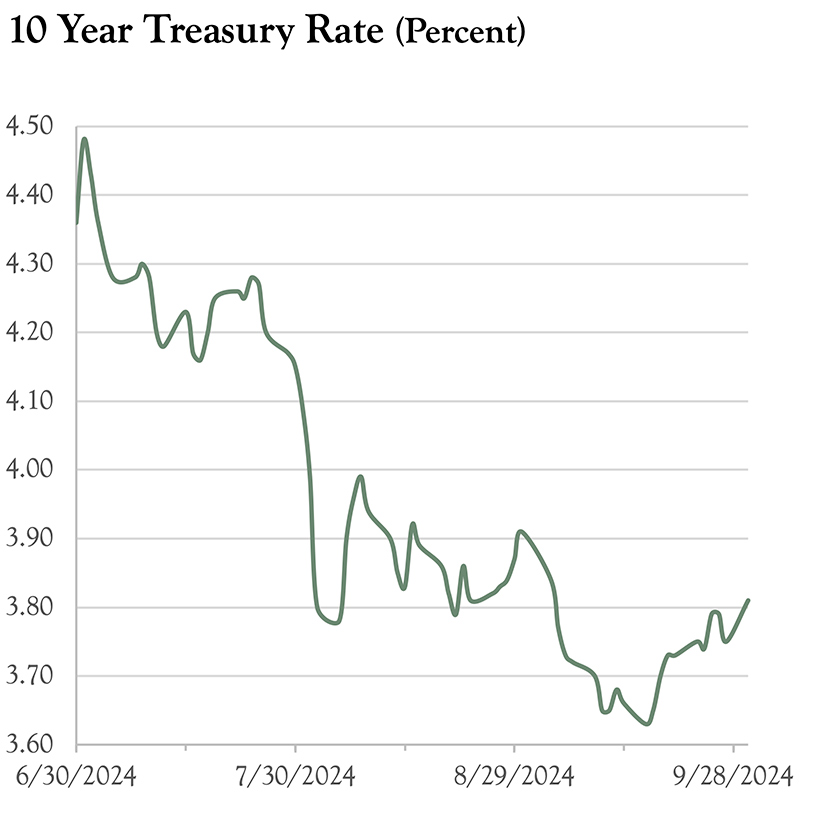
During the quarter, investors became more confident that the Federal Reserve would start to cut short-term rates. With economic data confirming a slowing of inflation, the Fed lowered the Fed funds rate by 0.5% in September. This was the first cut in interest rates since March of 2020 and marked the end of its tightening cycle which began in March 2022.
The beginning of the rate-cutting cycle, and market expectations of more cuts to come, put downward pressure on yields across the curve. Lower Fed funds translates to lower shorter-term yields. And, for the first time since the yield curve inverted in July 2022, the yield curve finally “normalized,” with short-term rates (2-year Treasury Note) dipping below longer-term rates (10-year Treasury Note). During the period, the 10-year Treasury yields also fell, moving from 4.36% down to 3.81%. This benefited fixed-income investors, as falling yields resulted in higher bond prices.
The diverse mix of economic reports during the quarter, however, points to uncertain economic outcomes. While the market cheered the Fed’s action, it is worth noting that a re-steepening of the yield curve could be the result of recessionary pressures already in motion, causing the Fed to cut its Fed funds rate in order to stimulate economic growth. Therefore, the Fed must remain data dependent as it moves forward in this new rate environment. We too are data dependent and have continued to remain focused on the shorter end of the yield curve (maturities between 2 and 5 years), as we feel longer maturities present limited opportunities for our clients.

Outlook
As we move into the fourth quarter, risks to investors appear two sided. For the bearish investors amongst us, the upcoming U.S. presidential election introduces unwanted volatility. While remaining neutral on the outcome, both candidates stated policy platforms appear to add to the country’s already bloated debt and deficit. Current Vice President Harris’s proposals include significant increases in government spending on social programs, healthcare and housing/infrastructure which could produce higher deficits if not matched by corresponding revenue increases. Former President Trump appears to focus on tax cuts and protectionist policies like tariffs, potentially reducing federal revenue if growth does not materialize. Ultimately, either choice could have an impact for years to come. Increasing debt and deficits could spark a revolt by bond market investors (sometimes called bond-market vigilantes) demanding higher rates given the greater uncertainty of government policy. This would result in higher bond yields (lower bond prices) and subsequently lower equity prices as higher rates lower future discounted cash flows.
For the bullish, the 0.5% cut at the September meeting proved to be yet another affirmation to investors that a recession will be avoided, producing the hoped for “soft landing” for the U.S. economy. While uncertainty around the size of future cuts remains, the direction of the Fed is clear and rates will continue to drop until a more neutral policy stance is reached. To some extent, that leaves a similar “play book” from the last 40 year years - lower rates leads to positive gains for equities and bonds. Additionally, there has been a significant build-up of cash in money market funds as a result of high short-term interest rates. As short-term rates drop, it is hypothesized that some money market assets will flow into the equity market, creating support for current stock prices.

Source: FactSet, FRB, Refinitiv Datastream, Standard & Poor’s, Thomson Reuters, J.P. Morgan Asset Management, and Oarsman Capital.
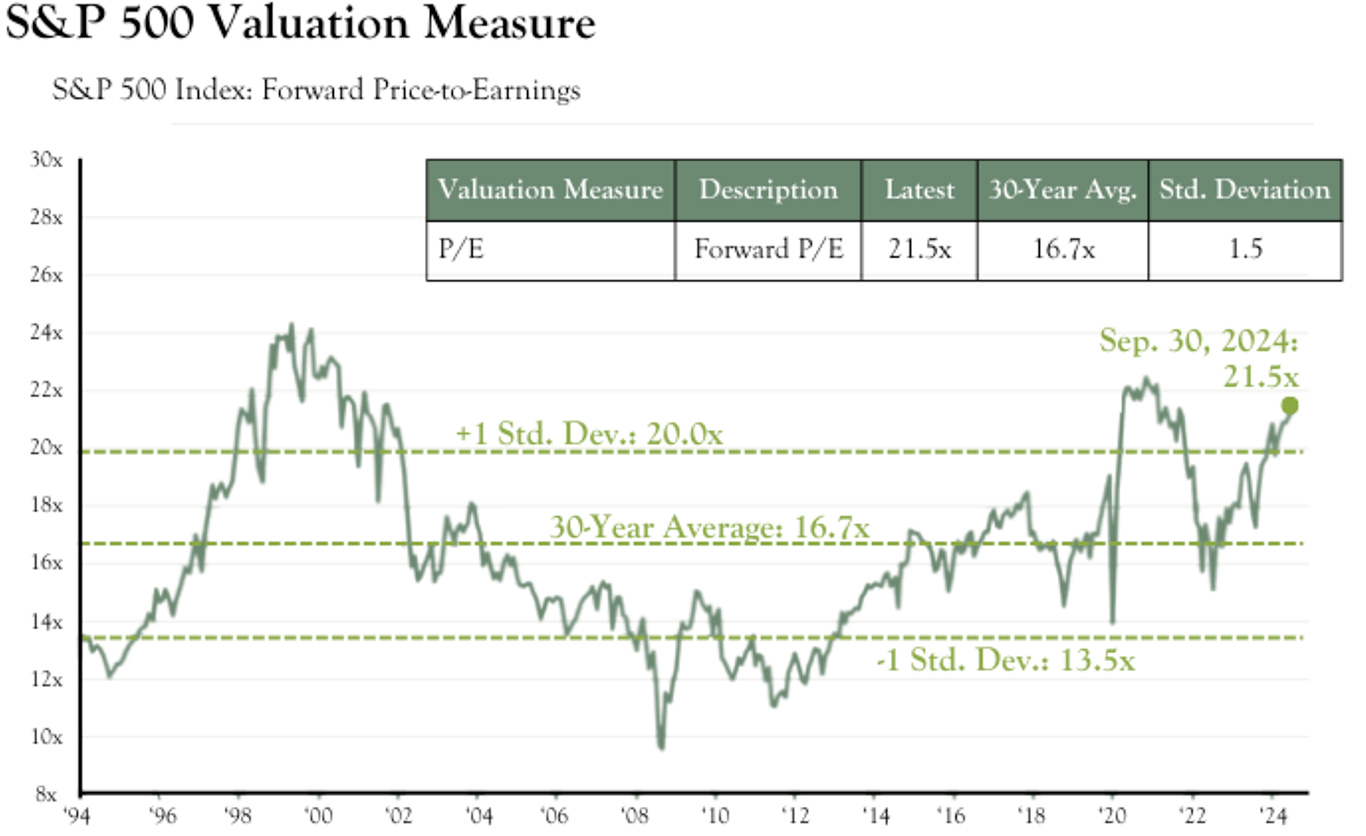
Price-to-earnings is price divided by consensus analyst estimates of earnings per share for the next 12 months as provided by IBES since March 1994 and by FactSet since January 2022. U.S. Data are as of September 30, 2024.
Given the Federal Reserve’s increased communication and “forward guidance” over the past few years, however, many investors have front-run the Fed in anticipation of cuts and bid up stock prices to a 21.5 times price-to-earnings multiple, historically expensive. While valuation has traditionally been a terrible timing mechanism, the S&P 500 is 1.5 standard deviations above a longer-term trend. While there is nothing to prevent the market from moving further from historical averages, we believe there are areas outside the largest of U.S. large caps that deserve our attention.
When the Magnificent Seven (Alphabet, Amazon, Apple, Meta, Microsoft, Nvidia, and Tesla) are removed from the S&P 500, valuation drops to a more reasonable 19.2 times price-to-earnings multiple. Not cheap but it does show the top-heaviness at the index level (e.g., potential risks to investors) and the opportunity for value to be found below the surface. Further down the market capitalization spectrum, mid-caps trade around 18 times price-to-earnings and small caps around 16 times. Increasing exposure to less expensive assets provides potential downside protection as there is less re-rating to occur in the event of a recession. If, however, the Fed does achieve a soft landing, and is able to continue to cut rates without the economy slowing down, these asset classes will benefit much more from rates dropping than their larger cap peers as their debt is often floating rate (lower rates leads to lower interest expense and higher profits). This presents a case for continued rotation in portfolios out of market-cap weighted S&P 500 into different areas, or at least greater diversification across segments.
In addition to domestic companies with lower market capitalizations, we are also looking overseas. The valuation of international stocks continue to look attractive, but unfortunately (fortunately for new investments) the valuation gap between U.S. and international has only grown over the past decade. Following the investing maxim ‘expensive assets have lower return expectations,’ it seems fitting to look to less expensive areas of the market for greater returns.
Outside of stocks and bonds, and given all of the unknowns, we continue to hold positions in “alternative” assets in our diversified portfolios. Allocations to gold and other commodities (including oil & gas stocks) is a hedge to some of the aforementioned global uncertainties while assets like high yield credit and preferred securities act as further diversifiers. We continue to hold cash equivalents, as they provide stability as well as optionality to a portfolio. Our intent in this uncertain environment is to help clients Find Your Balance® through an appropriate asset allocation designed to help you reach your goals.
If you would like to discuss any of the information herein in greater detail, please contact a member of our Team. Enjoy the beautiful fall weather!
Sincerely,
Your Oarsman Capital Team
