1Q 2024 Review and Outlook
Stock markets around the world continued where 2023 left off: moving higher as improving confidence about the economy and the prospect of decreasing interest rates combined with even greater optimism about the potential business opportunities in artificial intelligence (AI). The S&P 500 Index surged above 5,200 for the first time, climbing more than 10% to post its largest first-quarter gain since 2019 and posting nearly two dozen new highs without a significant pullback; the tech-heavy NASDAQ Composite registered its first record high since November 2021; and the Dow Jones Industrial Average closed above 39,000 for the first time. U.S. small-cap stocks also saw gains, as did developed and emerging international stock markets, but not enough to register new highs.
Energy stocks saw the largest gains during the quarter, followed by Communication Services and Financials. Real Estate was the only sector to post a negative return for the quarter.
After bond yields slid to end last year, they resumed their march higher with the 10-yr Treasury ending the quarter around 4.2%, some 42 basis points (bps) higher than the start, leaving investment grade bonds with small losses. High-yield bond returns were modestly positive
Strong start to 2024
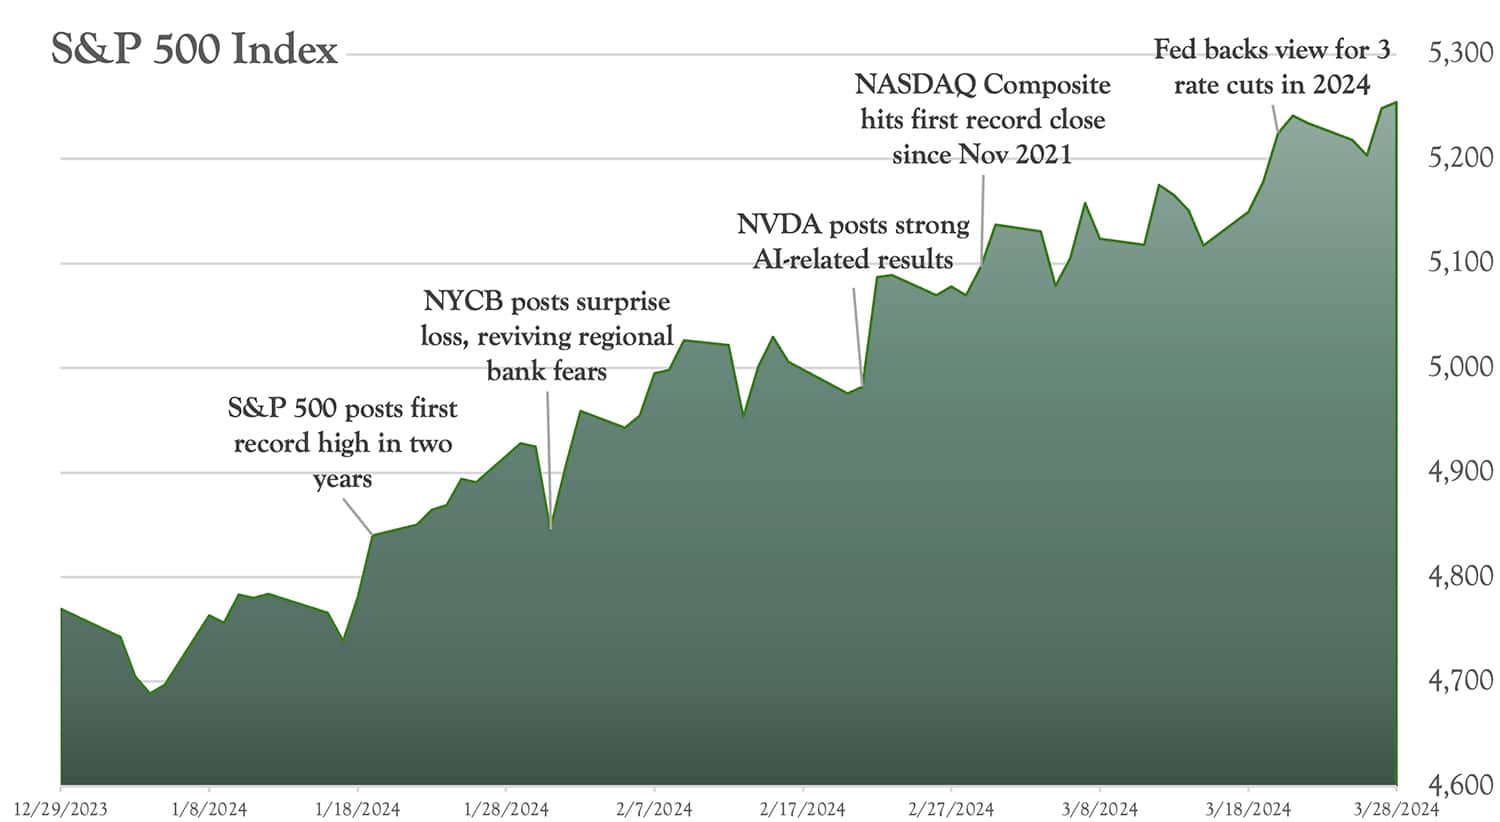
What drove the stock market?
In past letters, we included a table titled “What’s Changed?” It is a simple explanation of what happened in S&P 500 during the most recent period but does not necessarily explain why the market moved. Let’s explore the “why” by looking at the individual components that shape market changes.
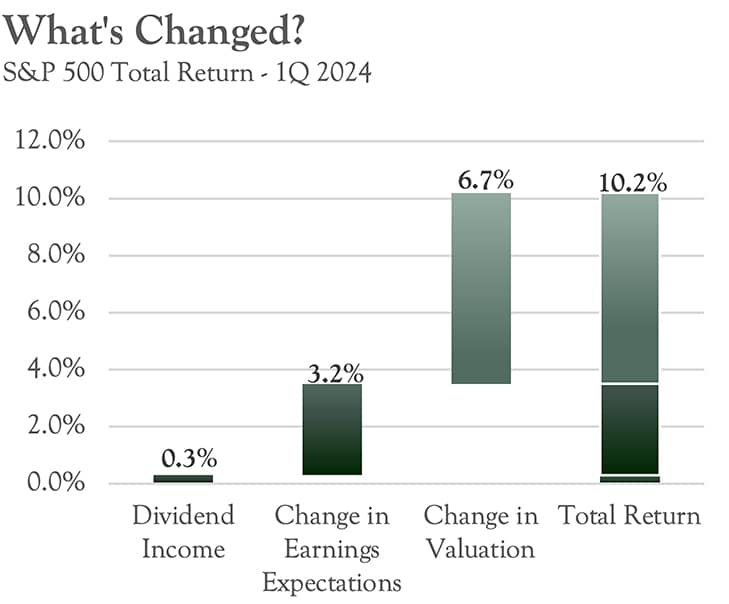
Dividend Yield: This is the most stable of the three factors. Dividend yields were around 0.3% this quarter (roughly 1.2% annualized). While this might not seem like a big number, historically dividends have contributed approximately 32% of total stock returns of the S&P 500 since 1926 1.
Change in Earnings Expectations: Over the long haul, earnings tend to drive stock prices. In this quarter, earnings expectations rose 3.2%. The increase comes from many factors, but notably: 1) the economy has proven to be more resilient than expected; 2) employment remains strong with the unemployment rate near record lows of 3.9%; and 3) a new factor - realized earnings from artificial intelligence.
The real (or hoped for) benefits of artificial intelligence manifested in real earnings for certain companies, notably Nvidia, which saw its earnings forecast from strong chip sales more than double. Will this continue? Projections certainly lean in that direction with each of the next six quarters showing a rise in earnings expectations.
Change in Valuation (Price/Earnings ratio): This number is likely to be more volatile than the earnings component – it is a measure of how investors value company earnings. Key to this quarter's gains has been confidence from investors that the economy is set for a "soft landing", in which inflation moderates but the economy avoids a severe downturn. This helped increase the market’s valuation (or price/earnings ratio). In the most recent quarter, the P/E ratio rose 6.7%. As with earnings, many factors play into the P/E ratio, among them investor sentiment and expectations. Indeed, bullish sentiment more than doubled from March 2023 through March 2024. (see chart to the right).
Such optimism helped drive up stock valuations with the S&P 500's forward P/E ratio climbing to more than 21 times, its highest level in more than two years, based on current Bloomberg estimates.
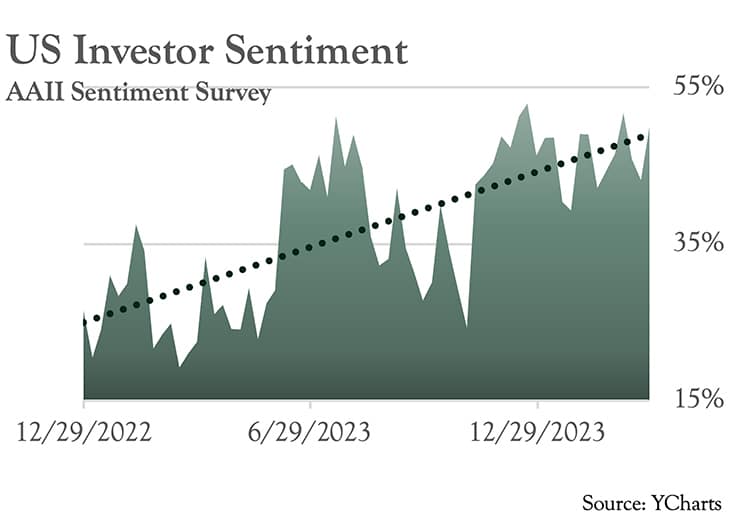
Such optimism helped drive up stock valuations with the S&P 500's forward P/E ratio climbing to more than 21 times, its highest level in more than two years, based on current Bloomberg estimates.
What drove the bond market?
Looking back on the first quarter of 2024, inflation news again played an outsized role in bond yield movement as U.S. CPI was reported higher than expected. Minutes from the Federal Open Market Committee's policy meeting in January provided transparency, but recent data has allowed a pause for Chair Powell and is putting pressure on the markets’ optimistic consensus of at least four rate cuts in 2024. During the quarter Goldman Sachs noted - "Comments this week from Fed officials and the minutes to the January FOMC meeting suggest that the first rate cut is unlikely to come as early as our previous forecast of the May meeting,". While the Fed continues to provide openness to its decisions, it is clear that anybody taking on new debt is likely to find it costlier - including the government.
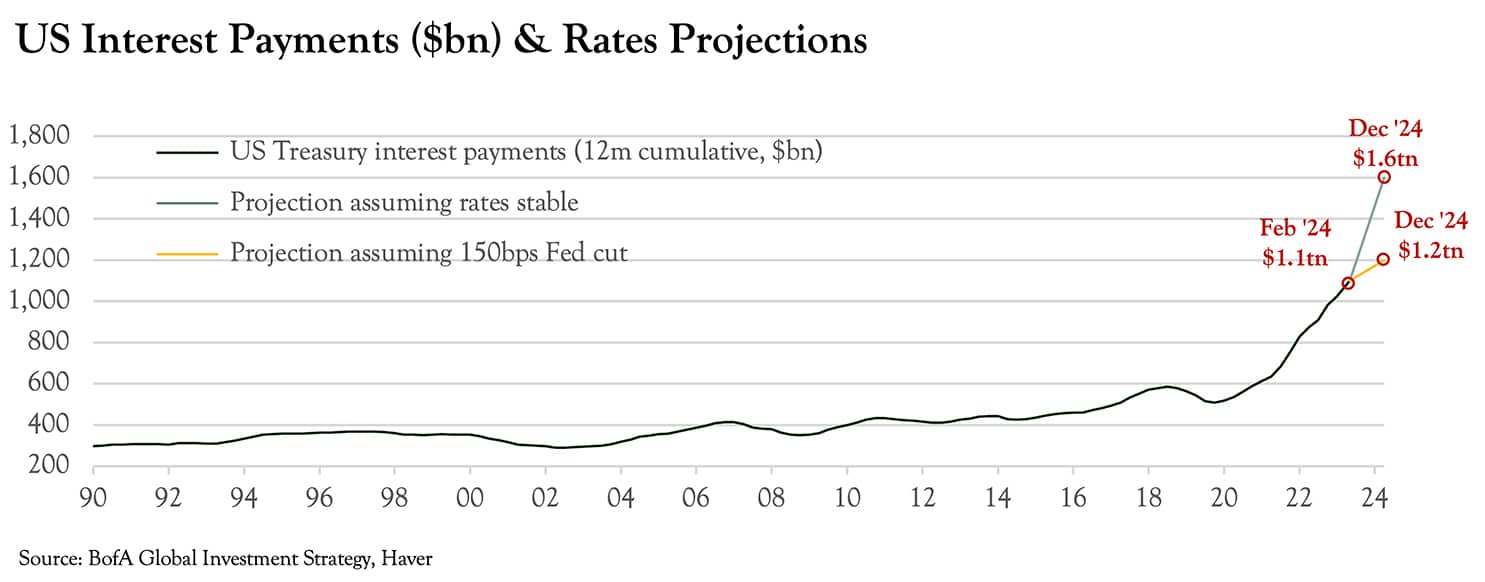
This chart from Bank of America Global Investment Strategy shows US Government interest payments have not only swelled post-COVID but also that the path of interest rates will affect future government spending. The difference between funding the government at current rates versus six 25 basis point cuts is a difference of hundreds of billions of dollars over the next couple of years.
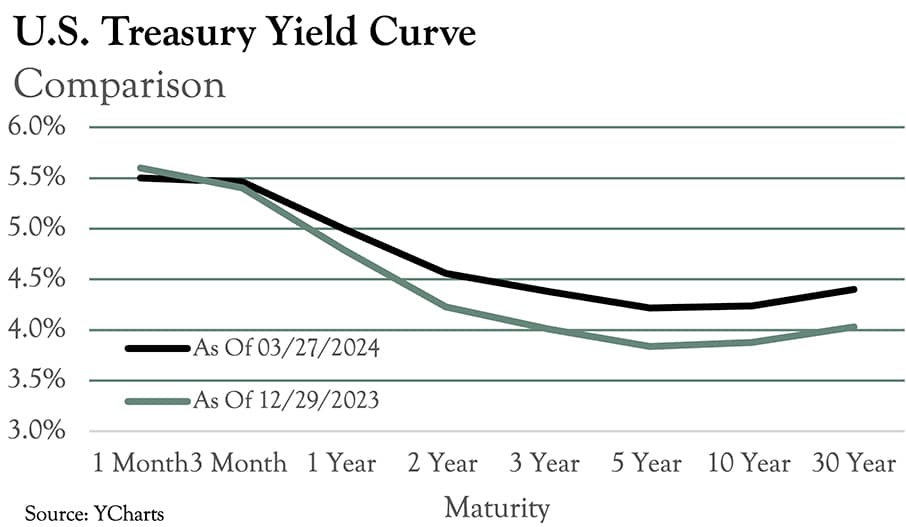
While the short end of the yield curve remained steady over the past 3 months, the longer end (longer maturity dates) moved up, resulting in a "flatter" yield curve.
Our read is that investors have gained more confidence in the US economy and increasing economic growth expectations. If this trend continues, we feel that longer maturity yields may continue to slowly rise (meaning respective bond prices fall) and we will continue to favor buying shorter maturity bonds.
Outlook
While we remain alert to the possibility that recent gains in the stock market could be ‘too far, too fast’, much of the recent economic data points to a strong economy (or at least a stronger economy than many expected). Unemployment remains steady below 4% (and below longer-term trends); the Job Opening and Labor Turnover Survey, or JOLTS, shows companies continue to hire; and personal consumption numbers continue to be higher than estimates, both nominal and adjusted for inflation. All indications point to a relatively healthy consumer that is both employed and spending money.
At the microeconomic level, a review of credit default swaps (CDSs), [traded contracts that hedge investors against the risk of defaults] shows a drop during the quarter. This positive development indicates investors are less concerned about the chances that corporations will default on their obligations, presumably due to an improvement in underlying fundamentals.
While only a few companies (the Fab 4 of Nvidia, Amazon, Meta, Microsoft) have grabbed the headlines, the earnings of many companies have improved. As noted earlier, $245 of earnings on the S&P Index at 5,254 leaves the market trading at lofty 21.5 times earnings. Much of this increase can be attributed to the enthusiasm around artificial intelligence and how it will eventually drive earnings and profit margins for business and, in turn, grow the economy. These expectations set a high hurdle for corporate America… high enough for many to trip over in the quarters ahead. If “hype” does not turn into reality, the market could see a downward re-rating, even if corporate earnings continue to hold up. Unfortunately, it is unclear if AI will truly drive the productivity gains that analysts currently expect. Some enthusiasm is warranted… but perhaps too much?
As evidenced by the record new highs in several indices outlined earlier, the rally has more stocks participating than last year’s “Magnificent 7” (Apple, Alphabet, Microsoft, Amazon, Meta, Nvidia and Tesla) that saw mega caps greatly outperforming the rest of the market. We see this as a positive development and remain optimistic about the ‘other’ names in the market and continue to find opportunities.
One notable asset class left off the new-highs list is US Small-cap. Small-caps faced some tough headwinds in 2023 (e.g., rising interest rates, a minor regional banking crisis). It’s easy to forget that small- cap stock valuations have historically traded at a premium to their large-cap counterparts. Since Covid, that premium has turned into a current 29% discount. This has also caused small-caps to be under-owned as a percentage of the total US market cap, currently 4% vs. the long-term average of 8%. We’ll continue to look for opportunities to add small-cap holdings to accounts.
We believe the US economy remains on solid footing as employment holds up and inflation holds the improvement made over the past year. While we anticipate an increase in stock market volatility at some point (volatility as measured by the VIX has fallen to multi-year lows – it won’t stay that way forever, and it is an election year!), we expect that to create investment opportunities, such as adding to high quality holdings or the aforementioned small-cap stocks. The bond market will continue to trade on Fed expectations and economic strength, which we believe will continue to allow us to take advantage of relatively high short-term rates.
Thank you for the confidence you place in Oarsman Capital. Please feel free to call or email anytime.
Sincerely,
Your Oarsman Capital Team
